Ranked Choice Voting ballots are easy to fill out.
RCVis makes the results easy to understand, too.
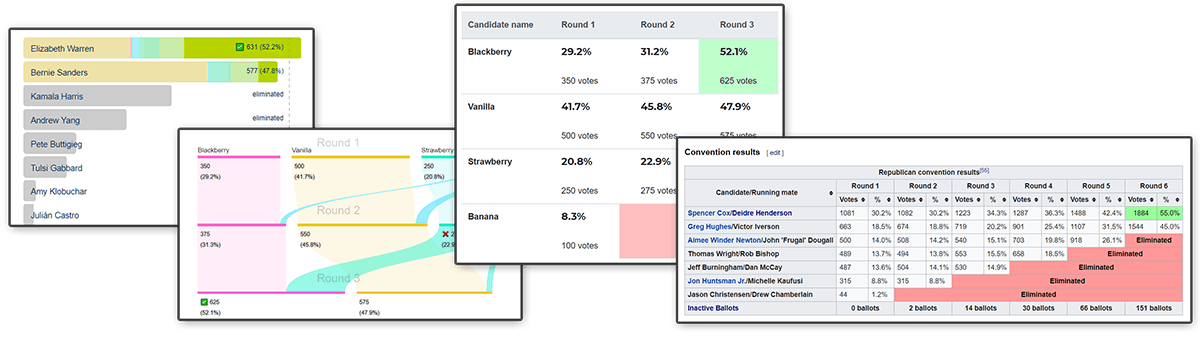
Charts, graphs, and tables to help your audience understand the results of a Ranked Choice Voting election. Export to Wikipedia, embed with HTML, or share to social media.
Useful for real elections, and for straw polls
It has hosted thousands of mock election results from RCV-compatible voting tools, including RankedVote.co, RankedChoices.com, and RCV123.org. It can import data from Opavote, ElectionBuddy, Dominion software, RCTab, and more.
Our visualizations have published in the Washington Post, Gothamist, on Ballotpedia, NBC New York, Fox 5 NY, and dozens of other news outlets.
Election Administrators: please get in touch if you'd like to use RCVis for an upcoming election. RCVis is free for most use cases, and we offer consultation services for customization and integration with your existing ENR pipeline.
What is Ranked Choice Voting?
RCV elections are just like a standard "first-past-the-post" election, except you can have backup choices. If your top pick has no chance of winning, you'll still have a say: your vote will count for your next choice.
Learn more on our medium post: An Illustrated Guide to Ranked Choice Voting.
Types of Visualizations
Bar Charts
Sankey Diagrams
Round-by-Round
Single Table Summary
Real-World Data
2021 New York City Elections
Single Transferrable Vote (STV), a.k.a. Multi-Winner RCV
Newest Data
Most recent visualizations created by our users
- All Time Presidents Election(YAPms Discord Mock Election) (4 candidates, 2 rounds)
- FOREVER NOW RemiXD (9 candidates, 8 rounds)
- 2007 Irish General Election in Clare (13 candidates, 9 rounds)
- 2007 Irish General Election - Cavan Monaghan (11 candidates, 4 rounds)
- Carlow Kilkenny 2007 (12 candidates, 9 rounds)
- ABCDEF sequential elect sequential transfer (8 candidates, 7 rounds)
- ABCDEF simultaneous elect simultaneous transfer (8 candidates, 6 rounds)
- Cambridge, MA 1999 School Committee Election with 7 seats (16 candidates, 12 rounds)
- New Zealand, Canterbury District Health Board, 2004 (31 candidates, 27 rounds)
- New Zealand, Canterbury District Health Board, 2004 <FONT SIZE=-1>by DemoChoice rules</FONT> (31 candidates, 27 rounds)
More Resources
RankedVote Polls

rankedvote.co
RCV123 Polls

rcv123.org
RankedChoices Polls

rankedchoices.com
Advocate for RCV

fairvote.org
Implement RCV

rcvresources.org
Tabulate an RCV election

rcvresources.org/rctab
Future Development
RCVis is free, open-source, and nonpartisan. These are our top projects. If you'd like to help fund the development of RCVis, or volunteer your time as a developer, please get in touch: [email protected].
- Accessibility: RCVis is not screenreader-friendly, though we have an undocumented audio captions for each visualization. We'd like to make these audio captions widely available, as well as making all RCVis visualizations screenreader-friendly.
- ES&S Data: We'd like to be able to upload and visualize data from Election Systems & Software voting machines.
- Infrastructure Updates: We'd like to use enable autoscaling to better support the influx of users and uploads on election night, as well as other infrastructure updates for stability and speed.
- "Blue Check" Verification: We'd like a system for displaying when a visualization hosted on RCVis has been vetted by an election administrator.
- User Dashboard: We'd like to provide users a method for managing their own visualizations, including modifying them, deleting them, and marking them as private.